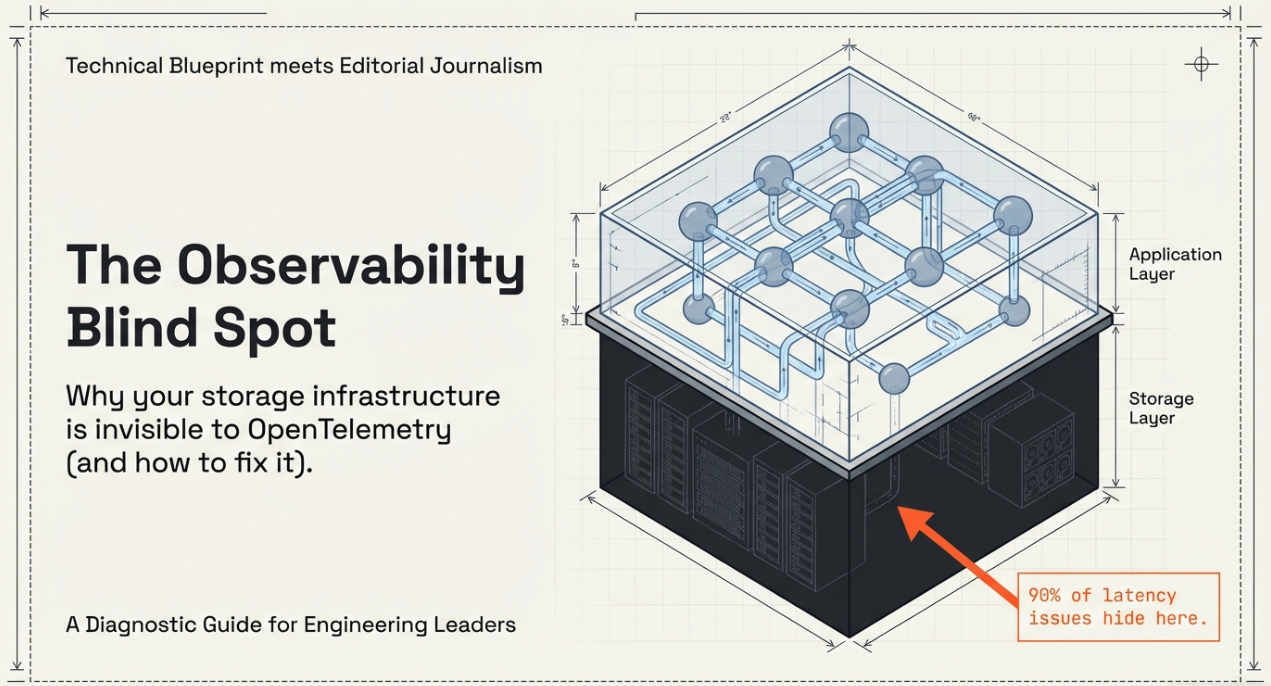
Introduction: The 3 AM Wake-Up Call Nobody Saw Coming
Your observability stack is humming. Grafana dashboards glow green. Distributed traces show requests flowing cleanly through your microservices. Prometheus alerts are quiet. Your SRE team has spent months instrumenting every service with OpenTelemetry, and the investment is paying off.
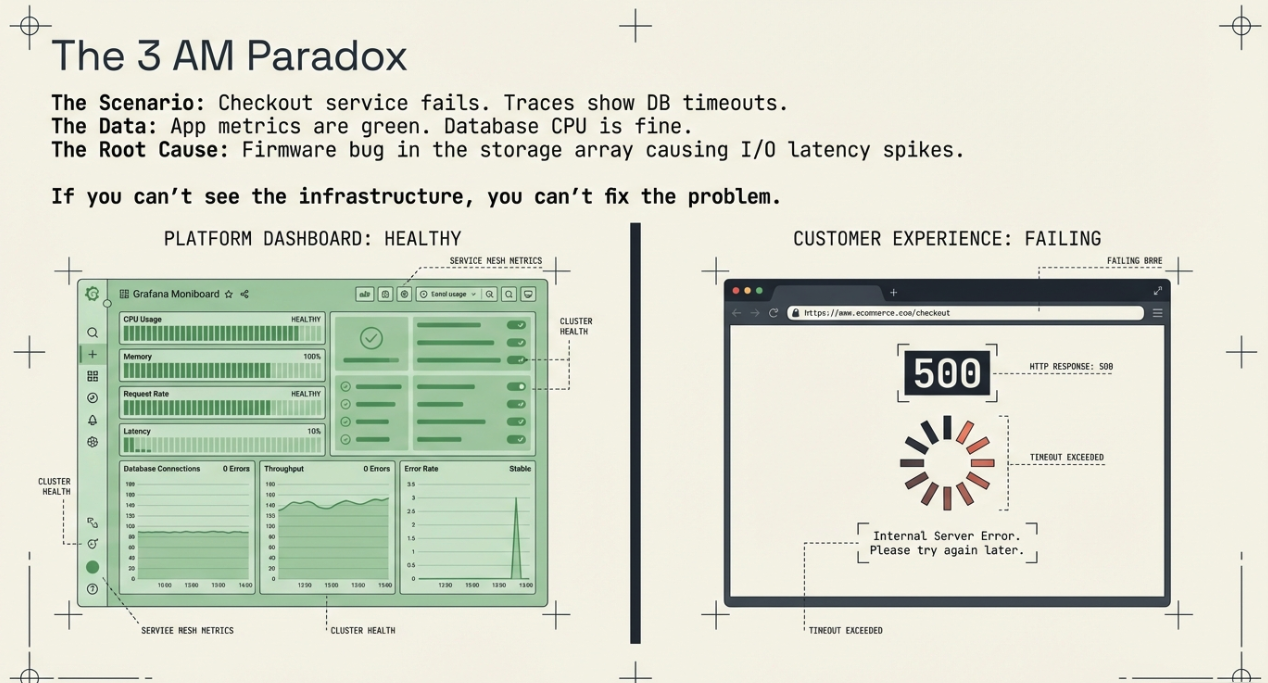
Then at 3 AM, your checkout service starts throwing 500 errors. The traces show database queries timing out, but the database metrics look healthy — CPU is fine, memory is fine, connections are well within limits. Your application dashboards can't explain the problem because the root cause isn't in your application layer at all.
It's the storage array backing your database volumes. A firmware bug is causing intermittent I/O latency spikes, and you can't see it because your storage infrastructure is completely invisible to your observability pipeline.
This scenario plays out more often than most engineering leaders want to admit. And it reveals a critical gap in how organizations approach OpenTelemetry adoption: they instrument the layers they can see while leaving the infrastructure they depend on in the dark.
Key Terms
Storage Appliance: A dedicated hardware or virtual device (SAN, NAS, hyperconverged) that provides block, file, or object storage to compute infrastructure. Examples include Tintri, NetApp, Pure Storage, Dell EMC, and Nutanix.
SNMP (Simple Network Management Protocol): A legacy protocol for collecting device metrics. Most storage appliances support SNMP, but it provides limited, poll-based visibility compared to modern telemetry.
Proprietary API: A vendor-specific REST, SOAP, or CLI interface that exposes storage metrics and management functions. Every storage vendor implements these differently.
Observability Coverage Map: An inventory of all infrastructure components categorized by their instrumentation status — fully instrumented, partially instrumented, or dark (no telemetry).
OTLP (OpenTelemetry Protocol): The standardized protocol for transmitting metrics, traces, and logs. Storage appliances do not natively speak OTLP, which is the core challenge this post addresses.
The Instrumentation Gap Nobody Talks About
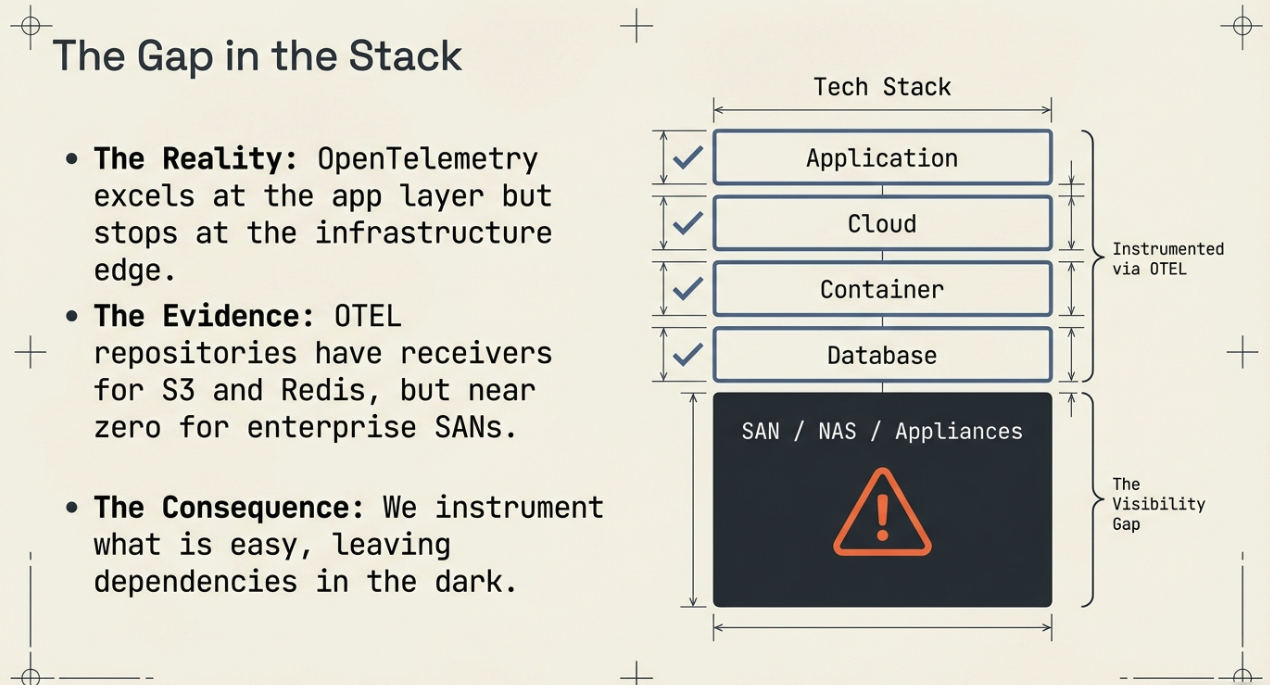
The OpenTelemetry ecosystem has made extraordinary progress. Auto-instrumentation covers dozens of application frameworks across every major language. The Collector ships with hundreds of receivers for Prometheus endpoints, StatsD, Jaeger, Zipkin, and cloud provider APIs. Semantic conventions standardize how we describe HTTP requests, database queries, and messaging systems.
But browse the OpenTelemetry Collector contrib repository and search for storage vendors. You'll find receivers for cloud object stores (S3, GCS) and database systems, but almost nothing for the enterprise storage appliances that sit underneath them — the SANs, NAS filers, and hyperconverged platforms that provide the block and file storage your databases, VMs, and containers actually depend on.
This isn't an oversight by the OTEL community. It reflects a structural reality about how storage infrastructure works.
Why Storage Remains a Dark Zone
Proprietary data models. Every storage vendor exposes metrics through a different API with a different schema. Tintri's REST API returns JSON objects describing VM-level storage analytics. NetApp's ONTAP API uses a completely different structure for volume and aggregate metrics. Pure Storage has its own REST interface. Dell EMC PowerStore uses yet another. There is no common standard for how storage systems describe their performance data.
Different metric semantics. When your application reports http.request.duration, the meaning is universal. But when a storage array reports "latency," it could mean host-to-controller latency, controller-to-disk latency, round-trip latency including replication, or something else entirely. Mapping vendor-specific metrics to meaningful OTEL semantic conventions requires deep domain knowledge of each platform.
Limited push capabilities. Most storage appliances were designed in an era of pull-based monitoring. They expose SNMP MIBs or REST endpoints that you poll on a schedule. They don't push OTLP to a collector endpoint. This means you need a custom collector process that periodically fetches data, transforms it, and exports it — exactly the pattern we covered in our previous post on building custom OTEL collectors with Python.
Operational isolation. Storage teams and application/platform teams often operate in separate organizational silos. The storage team uses the vendor's native management console. The platform team uses Grafana and Prometheus. Nobody has connected the two, because nobody owns the gap.
The Business Risk of Storage Blind Spots
The technical gap matters because storage problems have outsized business impact. Consider these scenarios that enterprise teams encounter regularly:
Silent performance degradation. A storage array's cache hit ratio drops from 95% to 60% over several weeks due to a workload change. Application response times gradually increase by 200ms. Users complain, but dashboards show application health as green because the latency increase is distributed across every request — it never triggers a spike-based alert. Without storage-layer visibility, the slow bleed continues until someone manually checks the vendor console.
Root cause misdirection. Database query latency increases. The DBA team investigates query plans, indexes, and connection pooling. The application team reviews code for N+1 queries. Neither team checks whether the underlying storage volumes are experiencing I/O contention from a noisy neighbor VM. Hours of troubleshooting time are wasted because the actual root cause is invisible to everyone looking at application-layer telemetry.
Capacity planning failures. Storage utilization data lives in the vendor's management portal, disconnected from the observability dashboards where infrastructure teams make capacity decisions. By the time someone notices a volume is 95% full, it's an emergency — not a planned expansion.
Compliance and audit gaps. Regulated industries require evidence of infrastructure monitoring. If your observability platform covers applications and compute but not storage, you have a gap in your monitoring evidence that auditors will eventually find.
The Storage Observability Landscape: What You're Dealing With
Not all storage systems present the same challenge. Understanding the landscape helps you prioritize where to invest.
Tier 1: Cloud-Native Storage (Mostly Solved)
Cloud provider storage services — AWS EBS, S3, Azure Blob, GCP Persistent Disk — already emit CloudWatch, Azure Monitor, or Cloud Monitoring metrics that can be scraped into OTEL using existing receivers. If your storage is entirely cloud-native, your gap is smaller (though not zero — CloudWatch metrics have 1-5 minute granularity, which may not be sufficient for latency-sensitive workloads).
Tier 2: Modern Enterprise Arrays with REST APIs (Buildable)
Platforms like Tintri, Pure Storage, NetApp ONTAP (9.x+), and Nutanix AHV expose comprehensive REST APIs that return JSON. These are excellent candidates for custom OTEL collectors. The APIs are well-documented, return structured data, and provide rich metrics including per-VM or per-volume performance data that maps well to OTEL metric instruments.
This is where the greatest opportunity lies for organizations running hybrid infrastructure. A single Python-based OTEL collector (following the architecture from our custom collector guide) can bridge the gap between a proprietary storage API and your OTLP-compatible observability backend.
Tier 3: Legacy Arrays with SNMP Only (Painful but Possible)
Older storage systems that only expose SNMP MIBs present the hardest challenge. The OTEL Collector does have an SNMP receiver in contrib, but SNMP data requires significant transformation to be useful — MIB OIDs need to be mapped to meaningful metric names, counter types need to be handled correctly, and polling intervals create inherent latency in the data. It's doable, but expect more engineering effort per appliance.
Tier 4: Proprietary Black Boxes (Requires Creative Approaches)
Some storage appliances offer no API at all — only a proprietary GUI or CLI. For these, you may need to parse CLI output, scrape management interfaces, or accept that full observability coverage isn't possible without the vendor's cooperation. These are your true blind spots, and the honest answer is sometimes that you need to push your vendor to provide API access.
A Framework for Prioritizing Storage Instrumentation
You can't instrument everything at once. Here's a practical framework for deciding where to start — the kind of planning exercise that should happen before any code gets written.
Step 1: Build an Observability Coverage Map
Before you write a single line of collector code, inventory your infrastructure. For every component in your stack, document three things:
- Current instrumentation status: Is it sending telemetry to your observability platform? Auto-instrumented, manually instrumented, or dark?
- Business criticality: What breaks if this component fails? Revenue-impacting? Customer-facing? Internal-only?
- API availability: Does it have a REST API, SNMP, both, or neither?
The result is a simple matrix:
| Component | Instrumented? | Business Impact | API Available? | Priority |
|---|---|---|---|---|
| Checkout microservice | ✅ Full OTEL | Revenue-critical | N/A | — |
| PostgreSQL primary | ✅ Prometheus exporter | Revenue-critical | N/A | — |
| Tintri T5000 (DB storage) | ❌ Dark | Revenue-critical | REST API | HIGH |
| NetApp FAS (file shares) | ❌ Dark | Operational | REST API | MEDIUM |
| Legacy SAN (archive) | ❌ Dark | Low | SNMP only | LOW |
| AWS S3 (backups) | ✅ CloudWatch | Operational | N/A | — |
The pattern that emerges is usually clear: your most business-critical storage systems are the ones most likely to be uninstrumented.
Step 2: Define What "Observable" Means for Storage
Not every metric a storage API exposes is worth collecting. Before building a collector, define the minimum viable set of metrics that would let you answer three questions:
- "Is the storage healthy right now?" — Latency (read/write), IOPS, throughput, error rates
- "Will it be healthy tomorrow?" — Capacity utilization, trend data, cache efficiency
- "Is it the cause of this incident?" — Per-volume or per-VM performance data that correlates with application-layer symptoms
This is where the cardinality management principles from our cardinality guide become critical. A Tintri array can report per-VM storage analytics for hundreds of VMs. Do you need per-VM granularity in your metrics pipeline, or can you aggregate to per-volume or per-datastore and use the vendor API for drill-down when needed? Answer this question before you write code, not after your Prometheus instance runs out of memory.
Step 3: Evaluate Build vs. Buy vs. Wait
For each priority storage system, you have three options:
Build a custom collector. If you have the engineering capacity and the vendor provides a good API, this is often the fastest path. The Python collector pattern from our previous post gives you a production-ready scaffolding. Plan for 2-4 weeks of development and testing per storage platform, including metric selection, error handling, and dashboard creation.
Buy a vendor integration. Some observability vendors (Datadog, Dynatrace, New Relic) offer pre-built storage integrations. These save development time but may lock you into a specific backend — which runs counter to the vendor-neutrality that makes OTEL valuable in the first place. Evaluate whether the integration exports via OTLP or only to the vendor's proprietary backend.
Wait for the ecosystem. The OTEL Collector contrib repository is growing rapidly. If your storage vendor is on a roadmap for a contributed receiver, waiting might be rational — but "waiting for the community" is not a strategy if your storage is revenue-critical today.
Step 4: Plan the Organizational Work, Not Just the Technical Work
This is the part most teams skip, and it's often the reason storage observability projects stall.
Identify the storage team stakeholders. If the storage team isn't involved in your observability initiative, you're building a collector that reads from an API you don't own, monitoring a system you don't operate, and creating alerts that will page a team that didn't ask for them. Get the storage team's buy-in early. Show them what unified visibility looks like. Make them partners, not bystanders.
Define the operational model. Who owns the collector process? The platform/observability team or the storage team? Who responds to storage alerts surfaced through the new pipeline? Who maintains the dashboard? These aren't technical questions — they're organizational ones, and they need answers before you deploy.
Align on alert boundaries. Storage teams already have alerting through their vendor consoles. Adding a second alerting pathway through your OTEL pipeline can create confusion unless you clearly define what gets alerted where. A common pattern: the vendor console handles hardware-level alerts (disk failures, controller failover), while the OTEL pipeline handles performance-level alerts (latency degradation, capacity thresholds) that correlate with application impact.
What Comes Next: From Planning to Building
This post has intentionally stayed at the planning and strategy level. The goal is to help you think through the decision framework before committing engineering resources to building storage collectors.
In upcoming posts, we'll go deeper into the technical implementation — building a production-grade OTEL collector for a specific storage platform, handling the unique challenges of mapping vendor-specific data models to OTEL semantic conventions, and wiring the resulting metrics into dashboards that correlate storage performance with application behavior.
For now, the actionable next step is straightforward: build your observability coverage map. Open a spreadsheet, list every infrastructure component your applications depend on, and mark each one as instrumented or dark. The storage layer will almost certainly be the largest gap — and once you see it documented, the urgency of closing that gap becomes impossible to ignore.
Can't I just use SNMP to monitor storage? Why do I need an OTEL collector?+
SNMP can provide basic metrics, but it has significant limitations: poll-based collection introduces latency, the data lacks context (no correlation with application traces), and SNMP MIBs don't map cleanly to OTEL semantic conventions. A custom OTEL collector using the vendor's REST API typically provides richer data, lower latency, and seamless integration with your existing observability pipeline.
How do I convince my storage team to participate in an observability initiative they didn't ask for?+
Lead with their pain points, not yours. Storage teams spend significant time responding to "is storage the problem?" questions during incidents. Show them that unified observability eliminates those fire drills by providing shared visibility. When the application team can see storage metrics on the same dashboard as application traces, they stop blaming storage by default — which is something every storage admin wants.
What if my storage vendor doesn't have a REST API?+
If the vendor only offers SNMP, the OTEL Collector's SNMP receiver in the contrib repository can help, but expect more transformation work. If the vendor offers no programmatic access at all, escalate with your vendor — lack of API access for a business-critical appliance is a legitimate procurement concern. In the interim, some teams parse CLI output or scrape management UIs, but these approaches are fragile and not recommended for production.
Should I build one collector per storage vendor or one collector that handles multiple vendors?+
Start with one collector per vendor. Each vendor's API has unique authentication, data structures, and rate limits. Trying to abstract across vendors prematurely adds complexity without clear benefit. Once you have collectors for two or three vendors, patterns will emerge that may justify a shared framework — but let the architecture evolve from real experience, not from upfront abstraction.
How does this relate to the OpenTelemetry Collector's existing infrastructure receivers?+
The OTEL Collector has receivers for host metrics (CPU, memory, disk I/O at the OS level), Docker, Kubernetes, and cloud provider APIs. These cover the compute and orchestration layers well. The gap is specifically in the storage appliance layer — the physical or virtual devices that provide the volumes your compute infrastructure consumes. The host-level disk I/O metrics tell you what the OS sees, but they don't tell you what the storage array is experiencing internally (cache efficiency, controller utilization, replication lag, etc.).
Ready to Close Your Observability Blind Spots?
If you're running enterprise storage infrastructure that's invisible to your observability pipeline — or you're planning an OpenTelemetry rollout and want to ensure storage is included from the start — we can help.
At Integration Plumbers, we specialize in building custom OpenTelemetry collectors for enterprise infrastructure that doesn't have off-the-shelf instrumentation. From storage arrays to industrial IoT, from Oracle systems to proprietary appliances, our team has the deep integration expertise to make your dark infrastructure observable.
Let's map your observability gaps and build a plan to close them.


