Introduction: When "Magic" Isn't Enough
OpenTelemetry's auto-instrumentation is genuinely impressive. With little more than a few environment variables, you can enable observability across your application without touching a single line of code. For standard web frameworks and common libraries, this approach works beautifully.
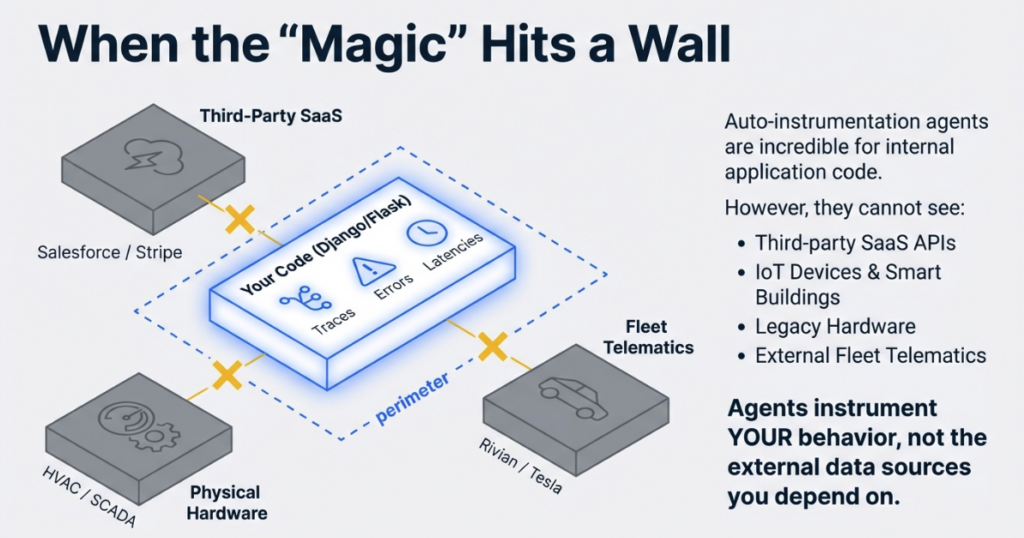
But auto-instrumentation has a fundamental limitation: it can only instrument your application's behavior, not the external data sources you depend on. Auto-instrumentation agents cannot follow API calls you are making -- they are designed to observe incoming requests, database queries, and outbound HTTP calls from within your process boundary.
This becomes a problem when you need visibility into external systems that lack HTTP handlers or database drivers:
- A third-party SaaS API that controls your building's HVAC system
- A legacy industrial controller running your manufacturing line
- A vehicle telematics API that tracks your fleet's battery health and tire pressure
This is where custom OpenTelemetry collectors become essential.
In this guide, we will build a production-grade OTEL collector in Python that pulls data from the Rivian vehicle API -- a real-world example of extending observability beyond your application perimeter. The patterns we cover apply equally to weather APIs, smart building systems, legacy SCADA hardware, or any data source where you need programmatic access to metrics.
Who this guide is for: You understand basic OpenTelemetry concepts (traces, metrics, exporters) and are comfortable with Python. Deep OTEL expertise is not required -- we will build that understanding as we go.
Key Terms
OTLP (OpenTelemetry Protocol): The standardized protocol for transmitting telemetry data between collectors and backends, supporting metrics, traces, and logs over gRPC or HTTP.
Metric Instrument: OpenTelemetry SDK objects that record measurements -- Gauges for fluctuating values (temperature, battery level), Counters for cumulative totals (requests served), and Histograms for distributions.
MeterProvider: The factory pattern component in the OTEL SDK that creates and manages metric instruments, analogous to TracerProvider for distributed tracing.
Periodic Exporting: A batching strategy where the collector aggregates metrics in memory and flushes them to the backend at regular intervals, reducing network overhead and respecting API rate limits.
Resource Attributes: Metadata attached to all telemetry from a source (service.name, host.name, deployment.environment) that enables filtering and correlation across distributed systems.
How the Collector Works
Before diving into implementation, let's map out the collector's architecture.
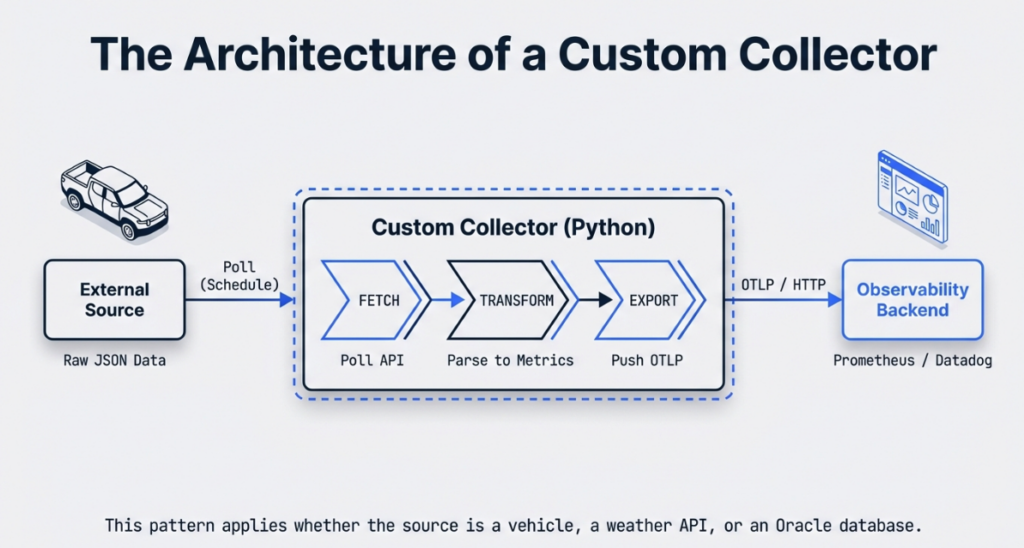
The collector sits between your data source and your observability backend, performing three functions:
- Fetch: Poll the external API on a defined schedule
- Transform: Parse vendor-specific JSON/XML/CSV into standardized OTEL metrics
- Export: Push formatted telemetry to any OTLP-compatible backend
Key Python SDK Components
Three core OpenTelemetry SDK classes form the collector's backbone:
MeterProvider is the factory that creates metric instruments. Think of it as the central registry for all measurements your collector will produce. You configure it once with resource attributes (service name, environment) and exporters.
PeriodicExportingMetricReader controls the batching and transmission schedule. This is critical -- you don't send individual metric updates over the network; instead, you aggregate them in memory and flush every N seconds. This is essential for respecting API rate limits.
OTLPMetricExporter packages your metrics into OTLP format (Protocol Buffers or JSON) and transmits them to your backend via HTTP or gRPC. It handles serialization, compression, and retry logic.
The relationship: MeterProvider uses PeriodicExportingMetricReader, which uses OTLPMetricExporter. Data flows through this pipeline: instrument -> reader -> exporter -> backend.
Setting Up the Development Environment
Modern Python development benefits from tools that eliminate dependency hell. We will use uv, a Rust-based package manager that is significantly faster than pip and handles virtual environments cleanly.
Installing uv
curl -LsSf https://astral.sh/uv/install.sh | shProject Initialization
# Create project directory
mkdir ip-rivian-otel && cd ip-rivian-otel

# Install and pin Python 3.14
uv python install 3.14
uv python pin 3.14

# Create virtual environment
uv venv --python 3.14

# Activate it
source .venv/bin/activate  # Linux/Mac
# .venv\Scripts\activate   # Windows
Required Dependencies
Create requirements.txt:
opentelemetry-sdk
opentelemetry-exporter-otlp
opentelemetry-exporter-otlp-proto-http
Install the dependencies:
uv pip install -r requirements.txtWhy Python for Collectors?
Python is the "glue language" of infrastructure engineering:
- Ubiquity: Pre-installed on virtually every Linux distribution
- Library Ecosystem: Thousands of API client libraries available for AWS, Google Cloud, and vendor-specific integrations
- Readability and Iteration: Teams can maintain collectors without deep language expertise, enabling rapid prototyping and refinement
For enterprise environments juggling Oracle integrations, cloud APIs, and legacy protocols, Python lets you move fast without sacrificing maintainability.
Step-by-Step Implementation
Step 1: Handling Git Submodules for API Libraries
Many third-party API clients exist as separate repositories. In the Rivian example, we use a community-maintained Python client as a git submodule. This pattern is common in enterprise integrations where you depend on external libraries that are not published to PyPI.
git submodule add https://github.com/the-mace/rivian-python-api.git ip_rivian_otel/rivian-python-apiUpdate .gitmodules:
[submodule "rivian-python-api"]
    path = ip_rivian_otel/rivian-python-api
    url = https://github.com/the-mace/rivian-python-api.git
When cloning the repository:
git clone --recurse-submodules <your-repo-url>Why Submodules? They pin a specific version of the upstream library, preventing breaking changes from affecting your collector. The tradeoff is added complexity -- team members must remember --recurse-submodules when cloning.
Step 2: Configuring the MeterProvider
Create ip_rivian_otel/__main__.py:
import os
from opentelemetry import metrics
from opentelemetry.sdk.metrics import MeterProvider
from opentelemetry.sdk.metrics.export import PeriodicExportingMetricReader
from opentelemetry.sdk.resources import SERVICE_NAME, Resource
from opentelemetry.exporter.otlp.proto.http.metric_exporter import OTLPMetricExporter

class IPRivianOTLP:
    def __init__(self, endpoint="http://localhost:4317"):
        # Define resource attributes for filtering in backend
        self.resource = Resource.create(
            attributes={
                SERVICE_NAME: "ip-rivian-otel",
                "deployment.environment": os.getenv("ENV", "dev"),
                "vehicle.owner": os.getenv("VEHICLE_OWNER", "fleet")
            }
        )

        # Configure OTLP exporter
        self.metric_exporter = OTLPMetricExporter(endpoint)

        # Set export interval (5 seconds for dev, 60+ for prod)
        self.reader = PeriodicExportingMetricReader(
            self.metric_exporter,
            export_interval_millis=5000
        )

        # Create provider
        self.meter_provider = MeterProvider(
            resource=self.resource,
            metric_readers=[self.reader]
        )

        # Set as global provider
        metrics.set_meter_provider(self.meter_provider)
Key Design Decisions
Resource Attributes: SERVICE_NAME is mandatory for OTLP. Additional attributes like deployment.environment enable filtering production versus staging metrics in Grafana or any other backend.
Export Interval: 5 seconds is aggressive -- appropriate for development where you want fast feedback. Production should use 60+ seconds to reduce network traffic and respect API rate limits.
HTTP vs. gRPC: We use OTLPMetricExporter with HTTP (proto.http). gRPC offers better performance but adds operational complexity. HTTP works with standard load balancers and proxies without additional configuration.
Step 3: Defining Metric Instruments
OpenTelemetry supports several instrument types, and you should select based on how values behave. Gauges track fluctuating measurements, Counters accumulate monotonically, and Histograms capture distributions.
For vehicle telemetry, Gauges are the right choice since battery levels and tire pressure fluctuate constantly.
def configure_instruments(self):
    meter = metrics.get_meter("rivian-telemetry")

    # Battery metrics
    self.battery_level = meter.create_gauge(
        "vehicle.battery.level",
        description="Battery charge in kWh",
        unit="kWh"
    )

    self.battery_percentage = meter.create_gauge(
        "vehicle.battery.percentage",
        description="Battery state of charge",
        unit="%"
    )

    # Tire pressure status (binary: 0=low, 1=ok)
    self.tire_lf_status = meter.create_gauge(
        "vehicle.tire.pressure.front_left",
        description="Front left tire pressure status",
        unit="1"
    )

    self.tire_rf_status = meter.create_gauge(
        "vehicle.tire.pressure.front_right",
        description="Front right tire pressure status",
        unit="1"
    )

    # Charging state
    self.charger_connected = meter.create_gauge(
        "vehicle.charger.connected",
        description="Charger connection status",
        unit="1"
    )
Naming Conventions
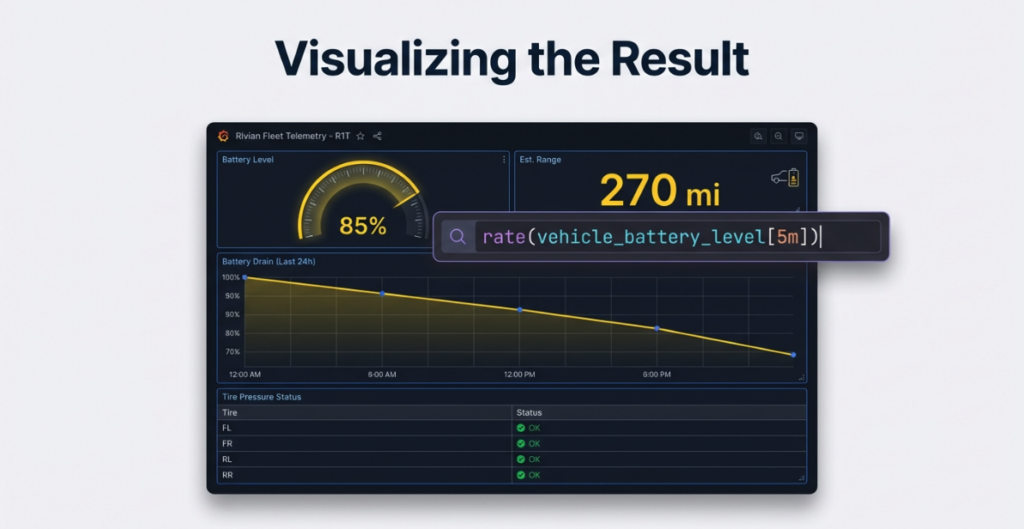
Follow OpenTelemetry semantic conventions when available. For custom metrics, use a hierarchy: domain.component.attribute (e.g., vehicle.battery.level). This makes Prometheus queries intuitive:
rate(vehicle_battery_level[5m]) # Battery drain rateStep 4: The Collection Loop
This is the heart of your collector -- fetch data, parse it, update instruments:
import time
import logging

logging.basicConfig(level=logging.INFO)
logger = logging.getLogger(__name__)

def collect(self, sleep_interval=90):
    """
    Main collection loop with error handling
    """
    try:
        while True:
            try:
                # Fetch vehicle data from API
                vehicles = self.rivian_get_vehicles()

                if not vehicles:
                    logger.warning("No vehicles found, skipping cycle")
                    time.sleep(sleep_interval)
                    continue

                # Process first vehicle (extend for fleet management)
                v = vehicles[0]

                # Parse tire pressure (API returns "OK" or "LOW")
                tire_lf = 1 if v['state']['tirePressureStatusFrontLeft']['value'] == "OK" else 0
                tire_rf = 1 if v['state']['tirePressureStatusFrontRight']['value'] == "OK" else 0

                # Parse battery data
                batt_level = v['state']['batteryLevel']['value']
                batt_capacity = v['state']['batteryCapacity']['value']
                batt_percentage = round((batt_level / batt_capacity) * 100)

                # Parse charger status
                charger_status = 0 if v['state']['chargerStatus']['value'] == 'chrgr_sts_not_connected' else 1

                # Update OTEL instruments
                self.tire_lf_status.set(tire_lf)
                self.tire_rf_status.set(tire_rf)
                self.battery_level.set(batt_level)
                self.battery_percentage.set(batt_percentage)
                self.charger_connected.set(charger_status)

                logger.info(f"Updated metrics: Battery {batt_percentage}%, "
                    f"Charger {'Connected' if charger_status else 'Disconnected'}")

            except KeyError as e:
                logger.error(f"API response missing expected field: {e}")
            except Exception as e:
                logger.error(f"Collection cycle failed: {e}", exc_info=True)

            time.sleep(sleep_interval)

    except KeyboardInterrupt:
        logger.info("Shutting down collector...")
    finally:
        self.meter_provider.shutdown()
Critical Pattern
The nested exception handling structure serves a vital purpose. The inner try/except catches transient errors (API timeouts, malformed responses) without killing the collector. The outer try/finally ensures graceful shutdown -- the meter_provider.shutdown() call flushes any pending metrics before exit, ensuring no data is lost.
Step 5: Fetching Data from the External API
Your API interaction layer should handle authentication and parsing cleanly:
def rivian_get_vehicles(self):
    """
    Fetch vehicle inventory with error handling
    """
    try:
        # Authenticate (tokens managed via environment variables)
        owner = self.rivian_client.get_user_information()

        vehicles = []
        for v in owner['data']['currentUser']['vehicles']:
            vehicles.append({
                'id': v['id'],
                'vin': v['vin'],
                'model': v['vehicle']['model'],
                'state': self.rivian_get_vehicle_state(v['id'])
            })
        return vehicles

    except requests.exceptions.RequestException as e:
        logger.error(f"API request failed: {e}")
        return []
    except KeyError as e:
        logger.error(f"Unexpected API response structure: {e}")
        return []
Generic Pattern for Any API
This abstraction follows a three-phase approach that works for any external data source:
- Authenticate: Use OAuth tokens, API keys, or session cookies -- always stored in environment variables, never hardcoded
- Parse Response: Extract nested JSON fields with defensive
get()calls rather than direct dictionary access - Return Normalized Data: The collection loop should not care about vendor-specific response structures
This separation means you can swap data sources (weather services, smart building systems, Oracle Cloud APIs) without modifying the collection loop.
Conclusion: You Have a Working Collector -- Now What?
At this point, you have a fully functional custom OpenTelemetry collector. It authenticates against an external API, fetches vendor-specific data on a schedule, transforms that data into standardized OTEL metrics, and exports them to any OTLP-compatible backend. This represents a significant capability expansion -- your observability perimeter now extends beyond what auto-instrumentation can reach.
The five-step pattern we have examined is deliberately portable. The Rivian vehicle API is our example, but the architecture is identical whether you are pulling metrics from a weather service, a smart building controller, an Oracle Cloud API, or an industrial SCADA system. Configure a MeterProvider, define your instruments, build a resilient collection loop, and isolate your API interaction layer. Only the data source changes; the underlying structure persists.
However, getting metrics flowing is only the first milestone. Production environments introduce distinct challenges that deserve dedicated treatment:
- Rate limiting and backoff strategies -- respecting API quotas, implementing exponential backoff, avoiding throttling
- Cardinality management -- understanding how unbounded labels silently inflate Prometheus storage costs, designing metric dimensions for scale
- Deployment and self-monitoring -- running collectors as systemd services or Docker containers, instrumenting the collector itself for health visibility
- Visualization and alerting -- connecting metrics to Prometheus and Grafana dashboards that surface actionable insights
These production-readiness topics will be covered in future installments of this series. For now, identify one "dark" area in your infrastructure -- a system that is important but invisible to your current observability stack -- and build a minimal collector for it this week. You will be surprised what you discover.
Reference Implementation
The complete code from this guide is available at:
https://github.com/IntegrationPlumbers/ip-rivian-otel-public
Clone it, adapt it, and make it your own. The patterns are universal -- only the API endpoint changes.
Can I use this pattern with APIs that use webhooks instead of polling?+
Yes. Replace the while True loop with a web server (Flask, FastAPI) that listens for webhook callbacks. When the webhook fires, update your OTEL instruments. The MeterProvider and instrument definitions remain identical -- only the trigger mechanism changes.
What's the difference between using OTLP and a native Prometheus exporter?+
OTLP is vendor-neutral -- your collector can send to Prometheus, Grafana Cloud, Datadog, or New Relic without code changes (just swap the endpoint). Native Prometheus exporters lock you into a single backend. Use OTLP unless you need Prometheus-specific features like custom timestamp handling.
How do I test my collector without hitting the production API?+
Mock the API client in unit tests using Python's unittest.mock. For integration tests, use a staging API endpoint or VCR.py to record and replay HTTP interactions. The abstraction in Step 5 -- isolating API calls into their own method -- makes this straightforward.
Can I collect traces in addition to metrics?+
Absolutely. Add a TracerProvider alongside your MeterProvider using the same resource attributes. Wrap your API calls in spans (tracer.start_as_current_span()) to capture call durations and error details as distributed traces. Both providers share the same OTLP exporter pipeline.
Does this approach work for APIs that return data for multiple entities (e.g., a fleet of 100 vehicles)?+
Yes, but be mindful of cardinality. For small fleets, you can use metric labels to differentiate vehicles. For large fleets (thousands of entities), you will want to explore strategies like splitting into multiple collector instances or using resource attributes for high-cardinality identifiers. We will cover cardinality management in detail in the next post in this series.


